An extended assessment of Variable Renewal Energy (VRE) evening peak performance for the SE Australian power grid is presented. The generation data are reported for combined Wind+Solar sourced from the Aneroid Energy website maintained by Andrew Miskelly. Rooftop solar is not reported in the dispatchable/SCADA data by the Australian Energy Market Authority (AEMO) and has not been accounted for in this assessment.
The aim of this presentation is to report the dispatchable output of the VRE generators at the very peak of the daily evening load cycle for calendar year 2022. It is point data, but nevertheless representative of their output for the period. Note that the contribution of solar to the evening peak period generation is negligible.
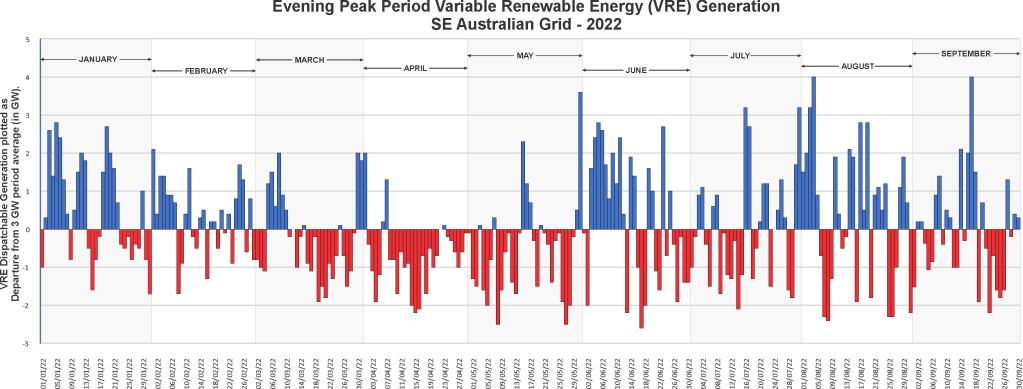
The data is presented as a departure from a chosen value, similar to how temperature variability is now commonly reported. The base value used here is the long-term capacity factor of wind generation in SE Australia (30%) as applied to the installed wind generator nameplate capacity (9.854 GW) which is rounded to 3 GW. The use of this value was supported by the actual average output of 3.1 GW for the study period.
The data in the graph below presents daily variations from the 3 GW long-term capacity factor. In an ideal world, the daily dispatchable generation should cluster close to the zero point (ie. 3GW), but the variability at the evening peak is worse that I thought, and strong seasonal influences are evident.
/Sarc Corner
How can the magnitude of renewable generation variability be presented so that it could be understood by the general public? One method used by the mainstream media is to compare, for example water volumes, to Olympic-sized swimming pools.
I propose a similar method to highlight renewable energy dispatchable power output variability by comparing it with a publicly identifiable object, such as Bayswater Power Station (BWPS).
BWPS has a nameplate capacity of 2.64 GW, and if a 75% capacity factor is applied, dispatchable output would be 2 GW. Therefore, 1 x BWPS 75%eq = 2 GW.
Presentations like the graph below could be used to illustrate the extreme variability of VRE output – equivalent to starting up and shutting down up to 3 Bayswater Power Stations on a daily basis!

